内容纲要
利用DeepXDE求解二维瞬态热传导方程。
DeepXDE是一个较为完善的PINN库,其封装了大量PINN建模时所需要编写的代码,可以使用当前流行的AI框架(如pytorch、TensorFlow、PaddlePaddle、Jax等),编写的代码比较简洁易懂。
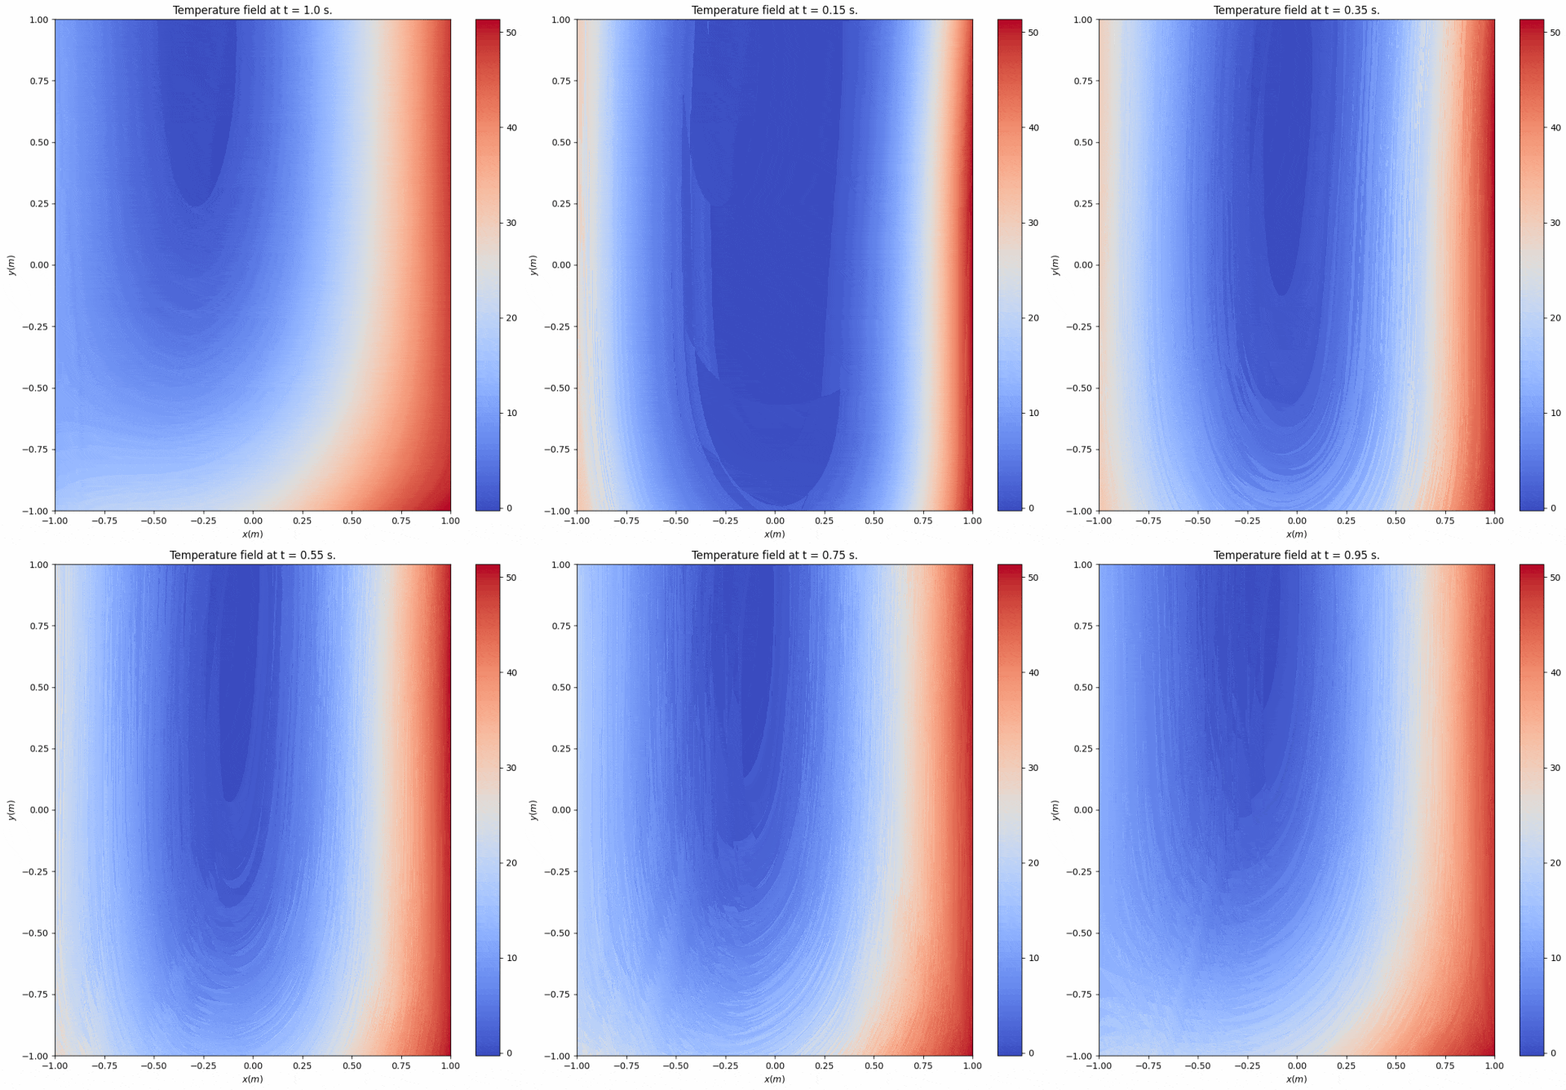
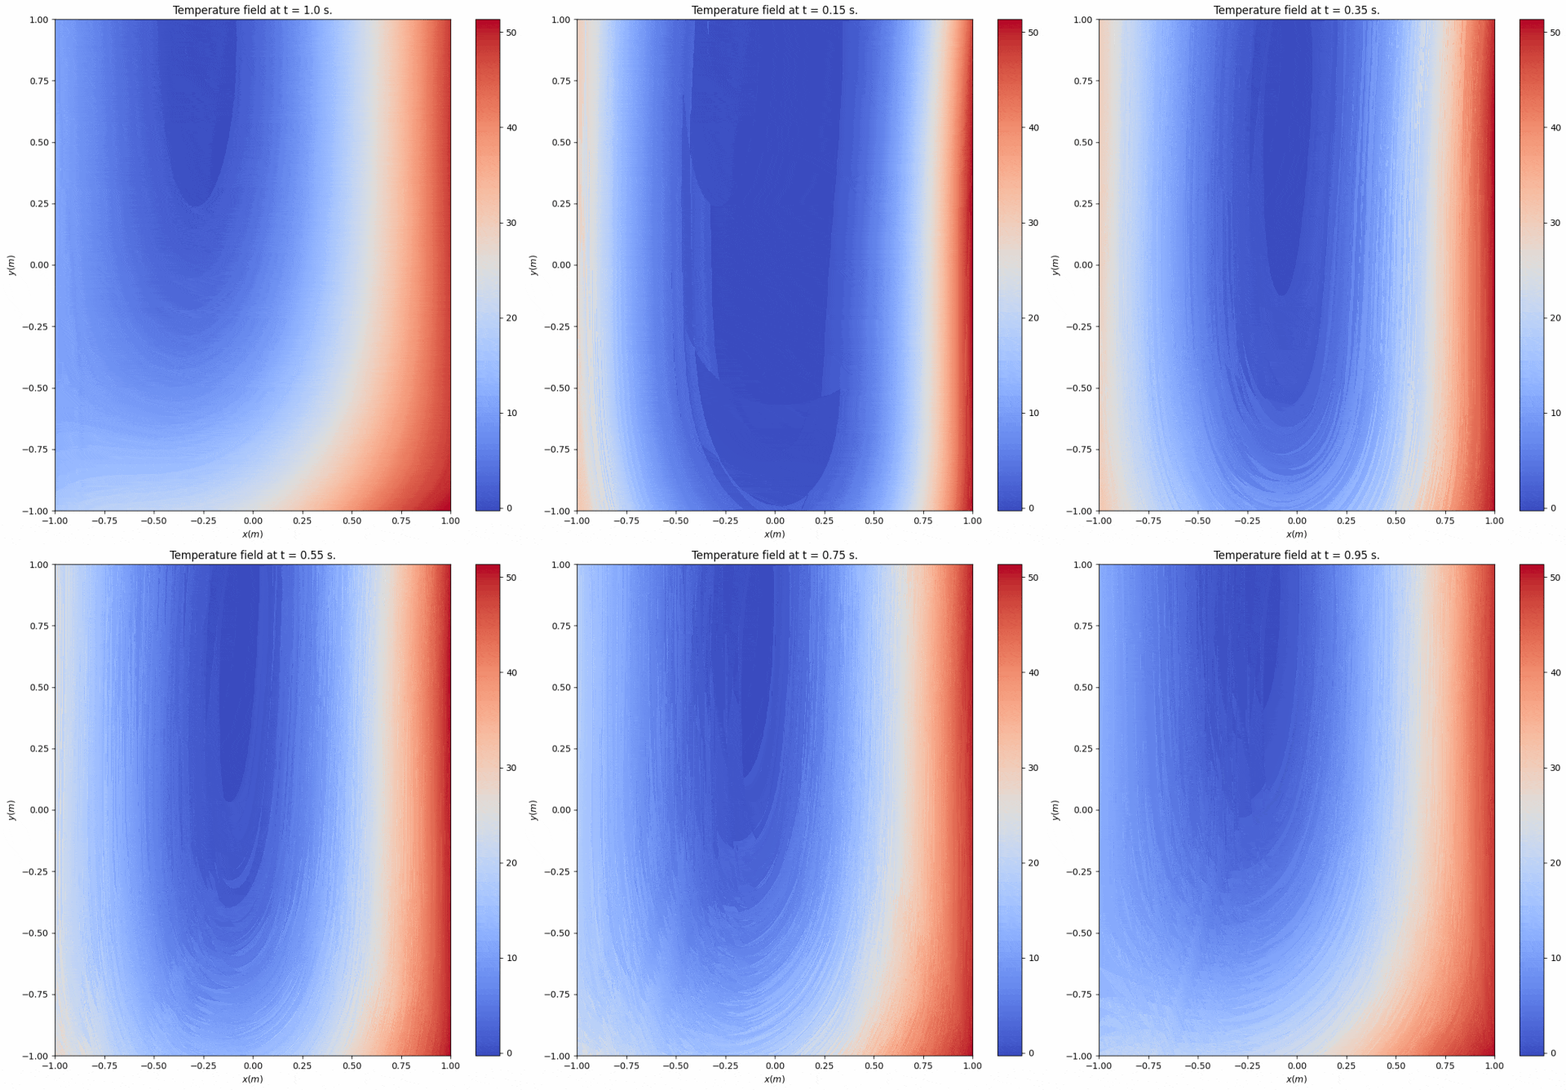
案例计算结果如图所示。

1 问题描述
二维瞬态传热方程:
案例中,,,。 为热扩散系数,。
计算模型及边界条件如下图所示。

计算区域为正方形,边长为2 m,各边界条件分别为:
-
左侧边界: -
右侧边界: -
底部边界: -
顶部边界:
初始条件:。
2 模型训练
2.1 导入必要的库
import deepxde as dde
import matplotlib.pyplot as plt
import numpy as np
from deepxde.backend import torch
2.2 指定计算区域
geom = dde.geometry.Rectangle([-1,-1],[1,1])
timedomain = dde.geometry.TimeDomain(0,10)
geomtime = dde.geometry.GeometryXTime(geom,timedomain)
2.3 定义PDE方程
alpha = 0.5
def pde(x,y):
    dy_t = dde.grad.jacobian(y,x,i=0,j=2)
    dy_xx = dde.grad.hessian(y,x,i=0,j=0)
    dy_yy = dde.grad.hessian(y,x,i=1,j=1)
    return dy_t - alpha * (dy_xx + dy_yy)
函数pde的参数中,第一个参数x是一个具有三个分量的向量,第一个分量x[:,0]为x坐标,第二个分量x[:,1]为y坐标,第三个分量x[:,2]为t坐标。参数y为网络输出。
2.4 定义边界
计算域中包含4个几何边界。案例中,上侧与下侧为Neumann边界,左侧与右侧为dIrichlet边界,这里直接为其赋值。
# 上边界,y=1
def boundary_t(x, on_boundary):
    return on_boundary and np.isclose(x[1], 1)

# 下边界,y=-1
def boundary_b(x, on_boundary):
    return on_boundary and np.isclose(x[1], -1)

# 左边界,x=-1
def boundary_l(x, on_boundary):
    return on_boundary and np.isclose(x[0], -1)

# 右边界,x=1
def boundary_r(x, on_boundary):
    return on_boundary and np.isclose(x[0], 1)


bc_t = dde.icbc.NeumannBC(geomtime, lambda x:0, boundary_t)
bc_b = dde.icbc.NeumannBC(geomtime, lambda x:20, boundary_b)
bc_l = dde.icbc.DirichletBC(geomtime, lambda x:30, boundary_l)
bc_r = dde.icbc.DirichletBC(geomtime, lambda x:50, boundary_r)
2.6 定义初始条件
初始值指定为0。
def init_func(x):
    return 0

ic = dde.icbc.IC(geomtime,init_func,lambda _,on_initial:on_initial,)
2.7 构造网络
这里采用6层全连接神经网络:输入层3个神经元;4个隐藏层,每层50个神经元;输出层1个神经元。激活函数使用tanh,初始化采用Glorot uniform。
data = dde.data.TimePDE(
    geomtime,
    pde,
    [bc_l,bc_r,bc_b,bc_t,ic],
    num_domain=8000,
    num_boundary=320,
    num_initial=800,
    num_test=8000,
)

layer_size = [3] + [50] * 4 + [1]
activation = "tanh"
initializer = "Glorot uniform"
net = dde.nn.FNN(layer_size, activation, initializer)

model = dde.Model(data, net)
model.compile("adam", lr=0.001)
2.8 模型训练
采用下面的代码训练10000步,并显示损失函数残差。训练轮次可以适当增加,比如可以训练30000步以进一步降低损失。
losshistory,train_state = model.train(iterations=10000,display_every=1000)
dde.saveplot(losshistory, train_state, issave=True, isplot=True)
3 计算结果
利用下面代码输出温度随时间变化动画。
import numpy as np
from matplotlib.animation import FuncAnimation
import matplotlib as mpl
import os

# x,y方向离散200个节点
x1 = np.linspace(-1,1,num=200,endpoint=True).flatten()
y1 = np.linspace(-1,1,num=200,endpoint=True).flatten()
xx1,yy1 = np.meshgrid(x1,y1)
x = xx1.flatten()
y = yy1.flatten()

# 时间上取20个时间步,时间步长1/20=0.05s
Nt = 20
dt = 1/Nt


for n in range(0, Nt+1):
    t = n * dt
    t_list = t*np.ones((len(x), 1))
    x_pred = np.concatenate([x[:, None], y[:, None], t_list], axis=1)
    y_pred = model.predict(x_pred)
    y_p = y_pred.flatten()
    data_n = np.concatenate([x_pred, y_pred], axis=1)
    if n == 0:
        data = data_n[:, :, None]
    else:
        data = np.concatenate([data, data_n[:, :, None]], axis=2)

print(x_pred.shape, y_pred.shape)
print(data.shape, data_n.shape)

# 创建图片保存路径
work_path = os.path.join('2DtransientRectTC',)
isCreated = os.path.exists(work_path)
if not isCreated:
    os.makedirs(work_path)
print("保存路径: " + work_path)

# 获得y的最大值和最小值
y_min = data.min(axis=(0,2,))[3]
y_max = data.max(axis=(0,2,))[3]
fig = plt.figure(100, figsize=(10, 10))

def anim_update(t_id):
    plt.clf()
    x1_t, x2_t, y_p_t = data[:, 0:1, t_id], data[:, 1:2, t_id], data[:, 3:4, t_id]
    x1_t, x2_t, y_p_t = x1_t.flatten(), x2_t.flatten(), y_p_t.flatten()
    print(t_id, x1_t.shape, x1_t.shape, y_p_t.shape)

    plt.subplot(1,1,1)
    plt.tricontourf(x1_t, x2_t, y_p_t, levels=160, cmap="coolwarm")
    cb0 = plt.colorbar(mpl.cm.ScalarMappable(norm=mpl.colors.Normalize(vmin=y_min, vmax=y_max), cmap="coolwarm" ),ax = plt.gca())

    plt.xlabel('$x (m)$')
    plt.ylabel('$y (m)$')
    plt.title("Temperature field at t = " + str(round(t_id * dt,2)) + " s.", fontsize = 12)
    plt.savefig(work_path + '//' + 'animation_' + str(t_id) + '.png')

print("data.shape[2] = ", data.shape[2])

# 创建动画
anim =FuncAnimation(fig, anim_update, frames=np.arange(0, data.shape[2]).astype(np.int64), interval=200)
anim.save(work_path + "//" + "animation-" + str(Nt+1) + ".gif", writer="pillow",dpi=300)
温度变化如图所示。

参考资料:https://aistudio.baidu.com/projectdetail/5489960(完)

本篇文章来源于微信公众号: CFD之道


评论前必须登录!
注册