
等值图(Contour),有时也称之为等高线图,是 CFD 后处理过程中用于显示空间物理量的一种常见的表现形式。本文以案例的形式描述在 ParaView 中创建等值图的基本方法。
1 导入数据
-
启动ParaView -
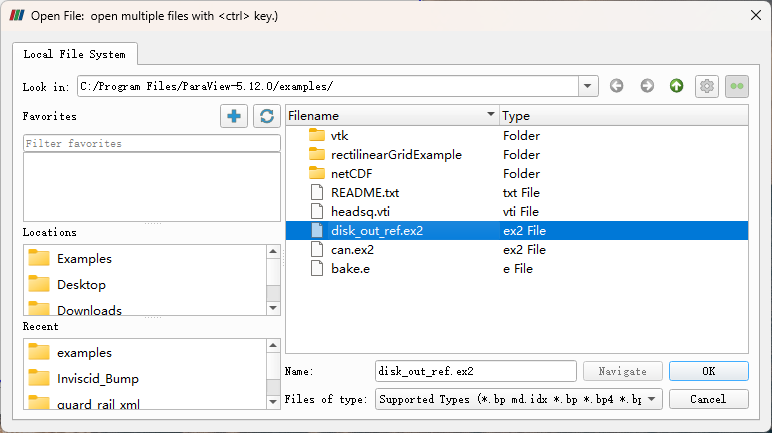
利用菜单 File → Open...从安装文件夹中加载文件disk_out_ref.ex2
-
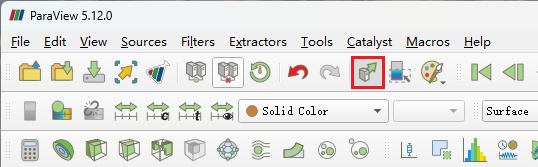
激活工具栏按钮 Apply changes to parameters automatically
注:激活此按钮后,在面板中进行的任何操作都不需要再点击Apply按钮,软件会自动确认。
”
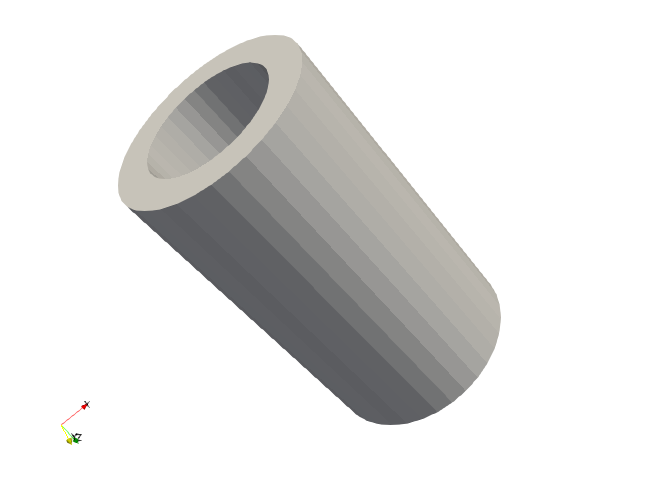
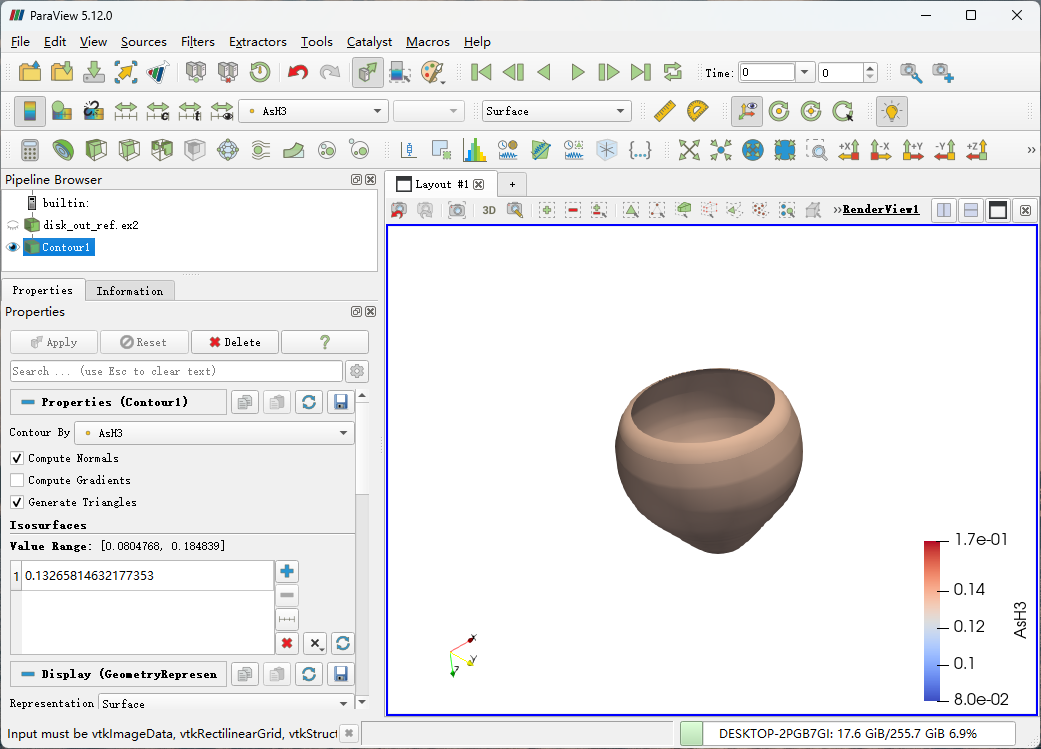
图形窗口如下图所示。
2 绘制等值图
-
选中管道浏览器节点 disk_out_ref.ex2 -
点击菜单 Filter → Common → Contour或点击工具栏按钮Contour添加过滤器
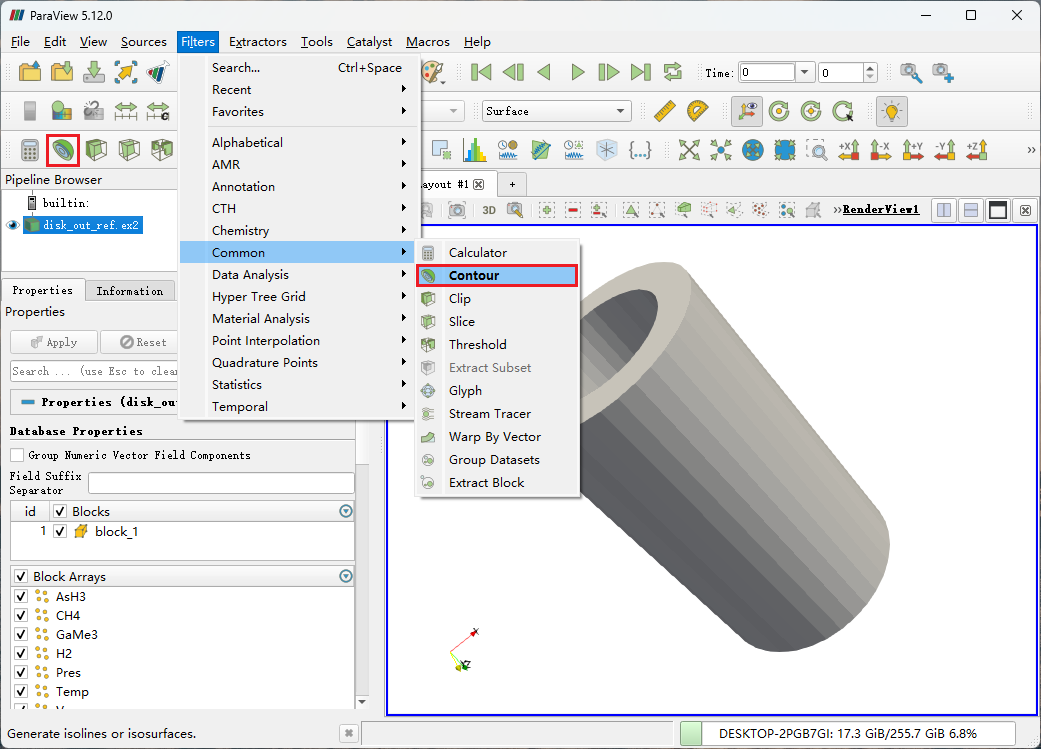
图形窗口如下图所示。
-
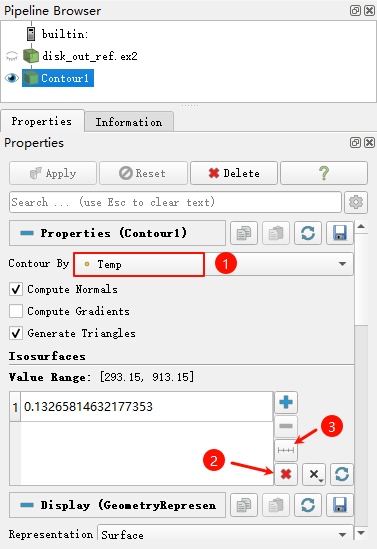
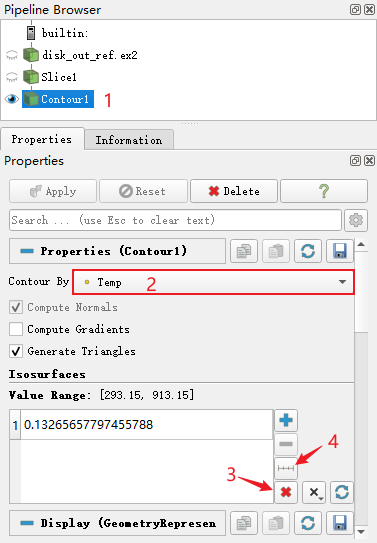
属性窗口中指定 Contour By为变量Temp,然后按下图所示顺序清除值显示范围,并添加新的值
-
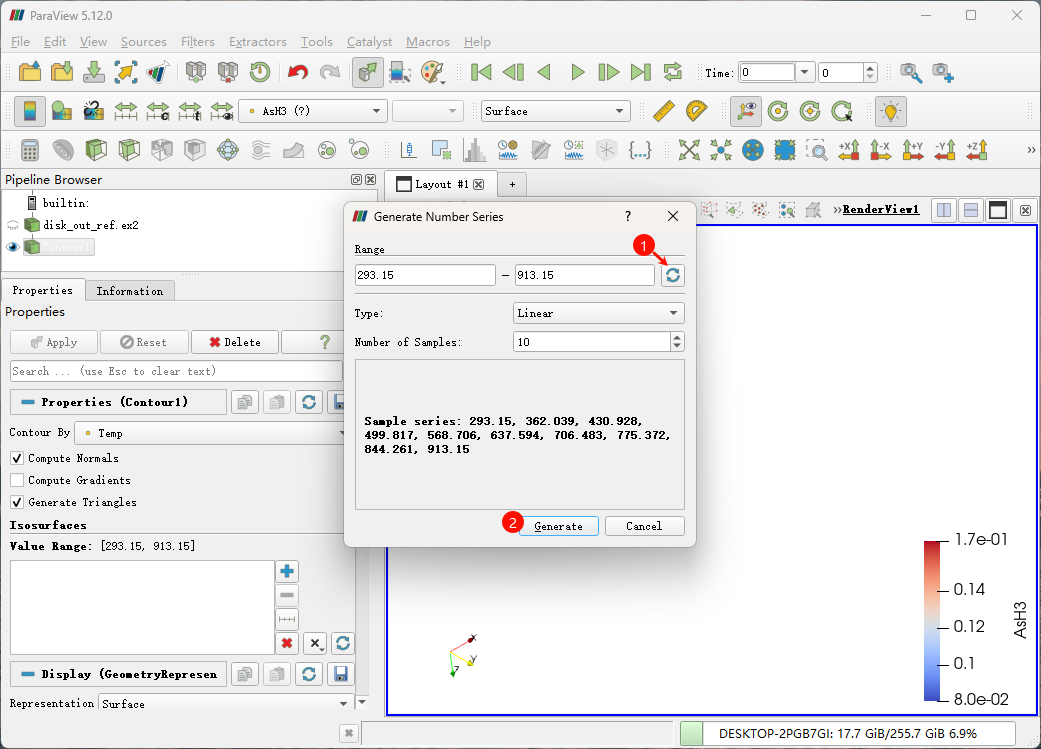
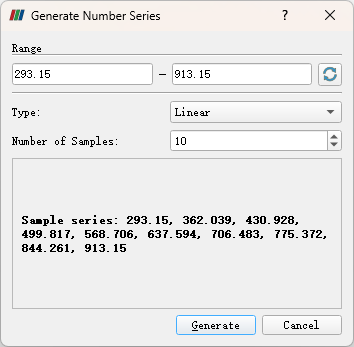
在弹出窗口中指定温度范围
-
指定温度显示为 Temp,如下图所示

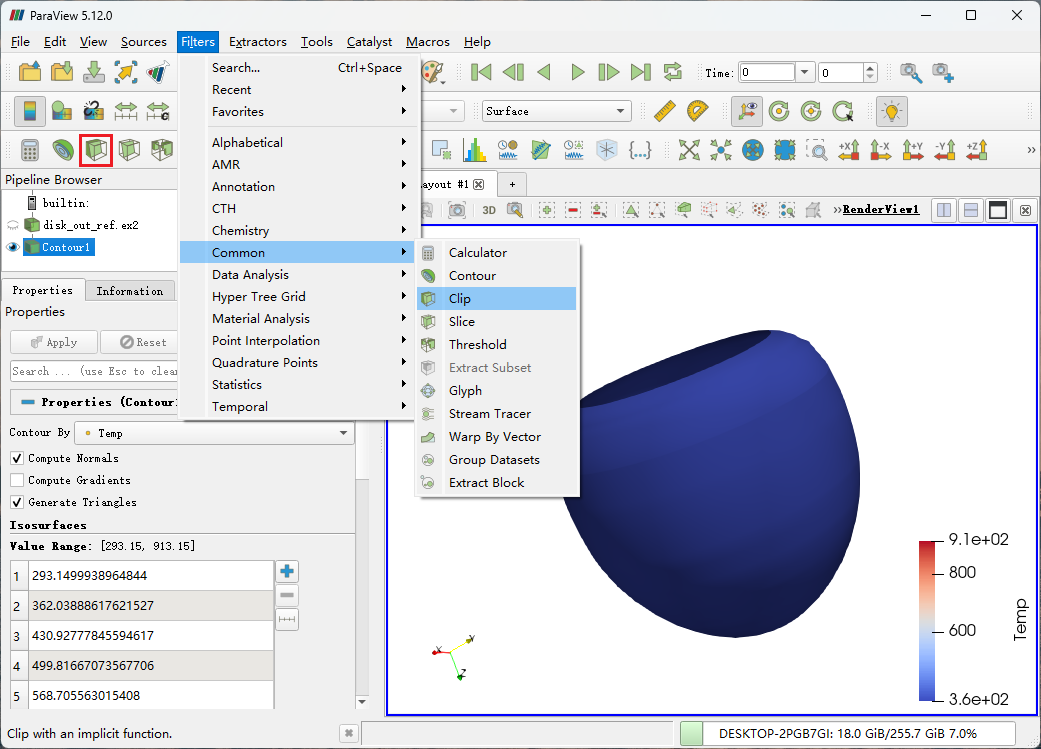
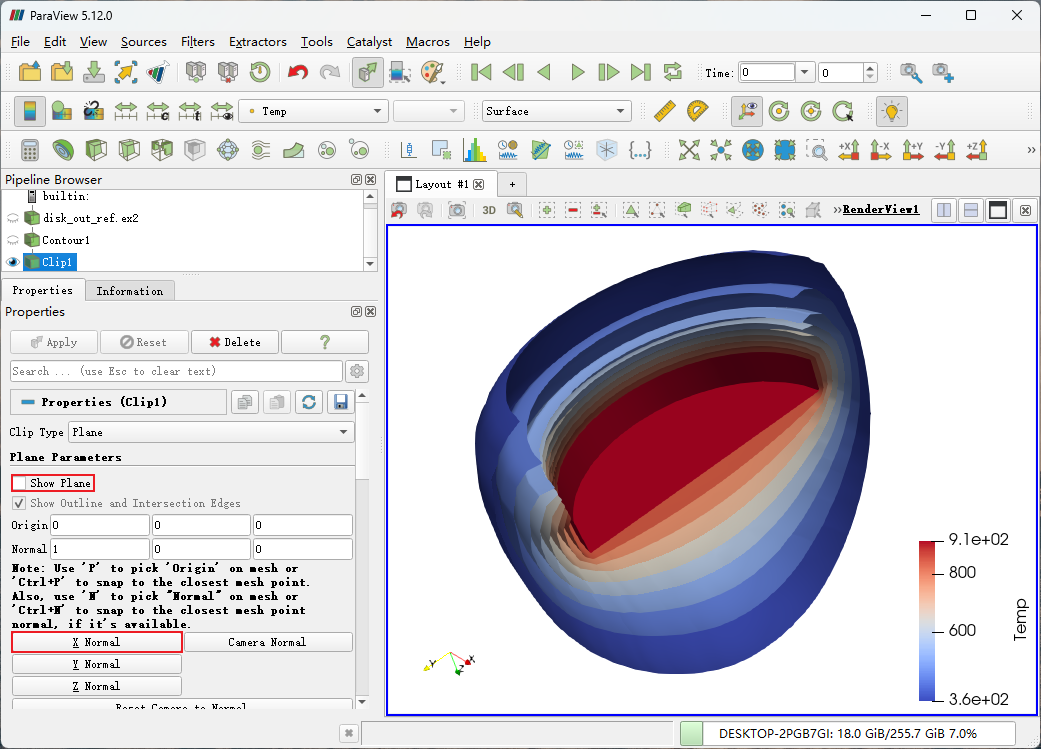
创建Clip将等值图剖分开便于观察。
-
选择管道浏览器节点 Contour1,点击菜单Filters > Common > Clip添加切片过滤器
-
属性窗口中指定切面为 X Normal,如下图所示
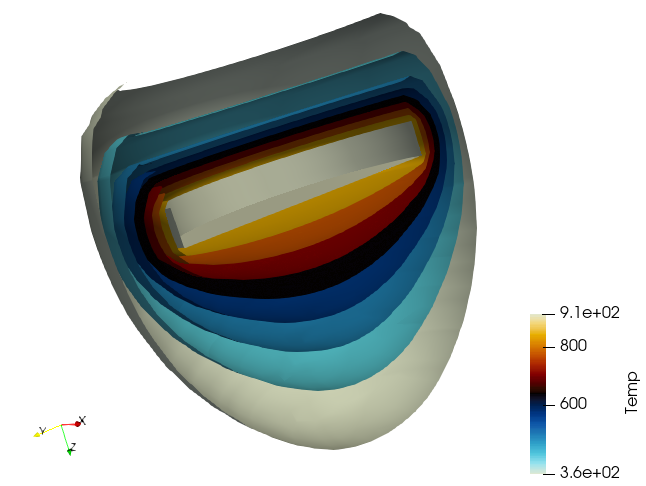
选择合适的colormap,图形窗口如下图所示。
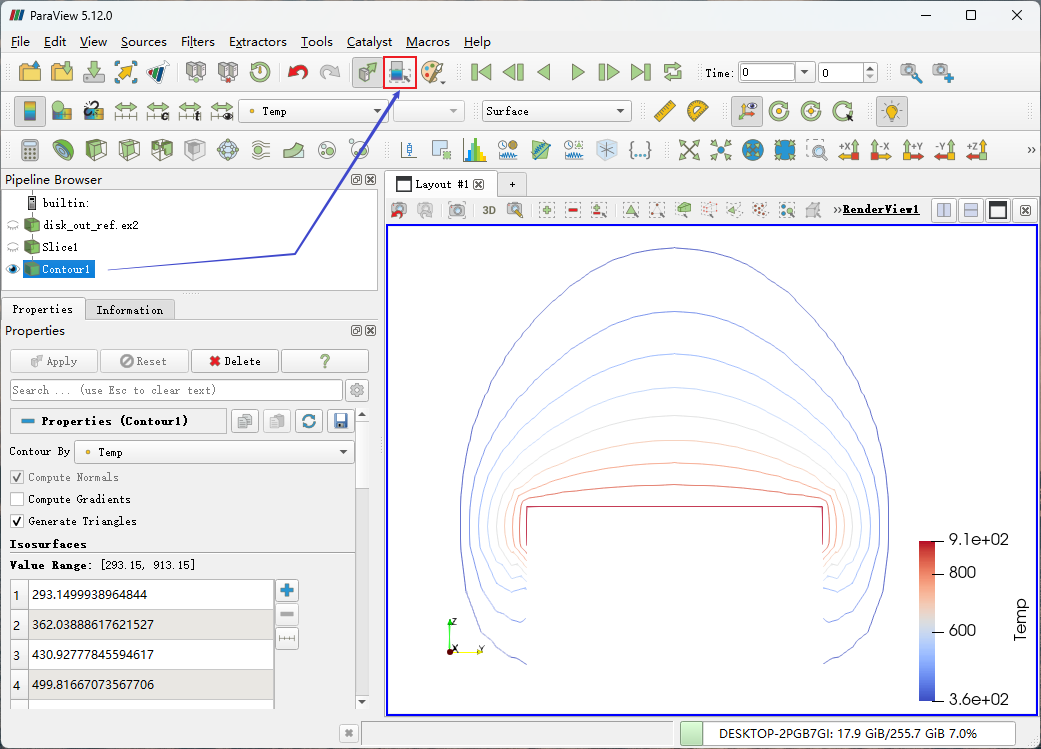
3 绘制等高线图
在ParaView中绘制带有标签的等值图不如Tecplot方便,但也是可以做的。
3.1 创建等高线图
-
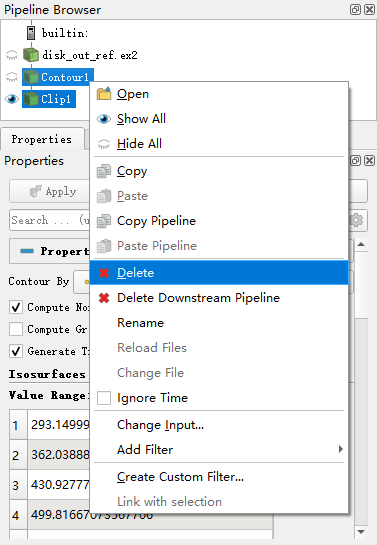
删除前面创建的Contour1与Clip1
-
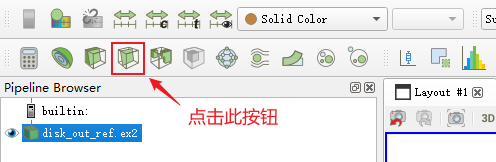
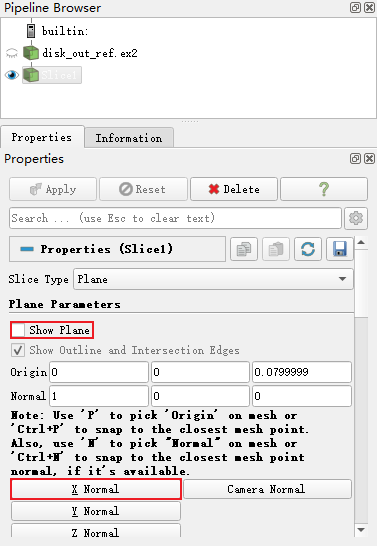
选中 disk_out_ref.ex2,点击工具栏Slice按钮
-
如下图所示指定Slice面为 x面
-
选中 Slice1,点击工具栏按钮Contour创建等高图

-
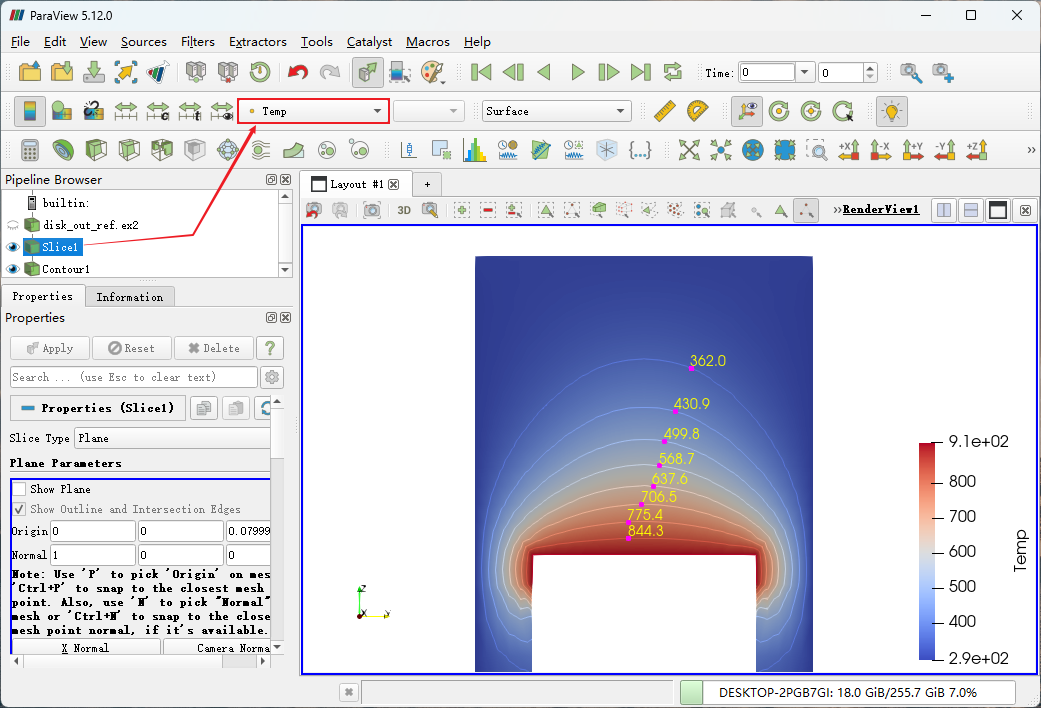
按下图所示顺序重新指定变量 Temp的数据范围
-
如下图所示设置温度范围
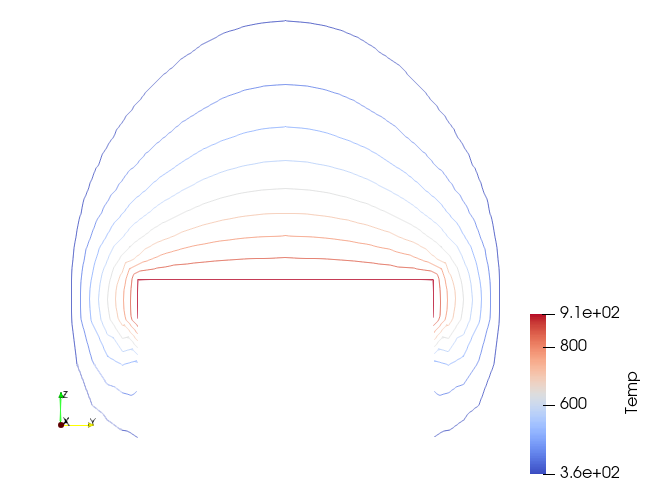
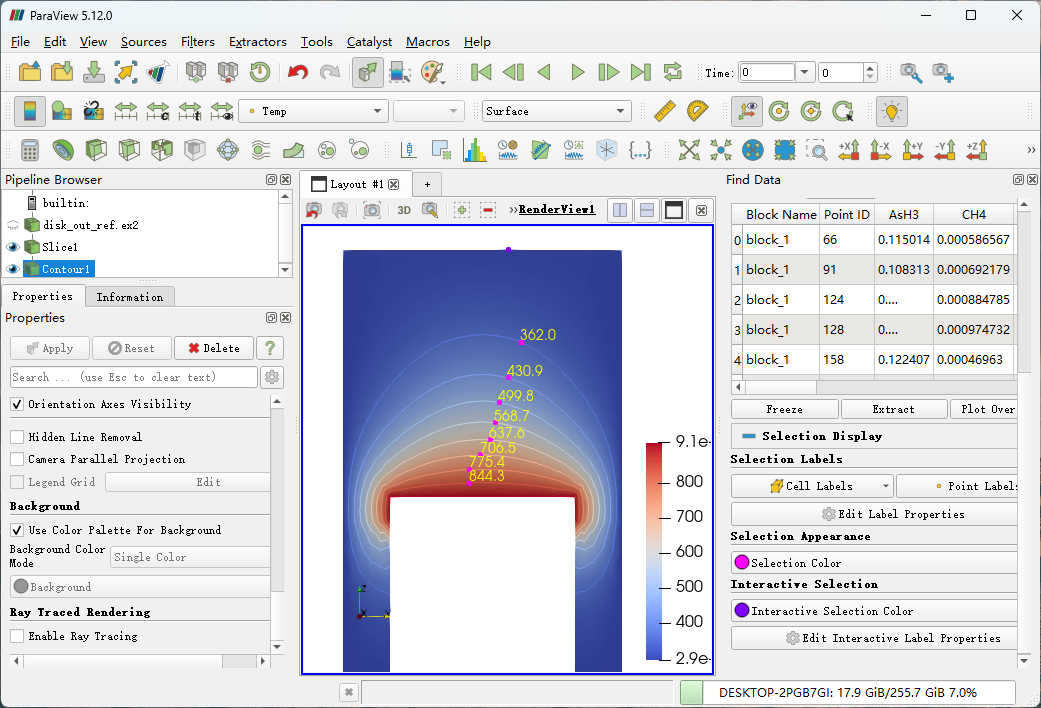
颜色显示指定为Temp,此时图形窗口如图所示。
3.2 添加Label
-
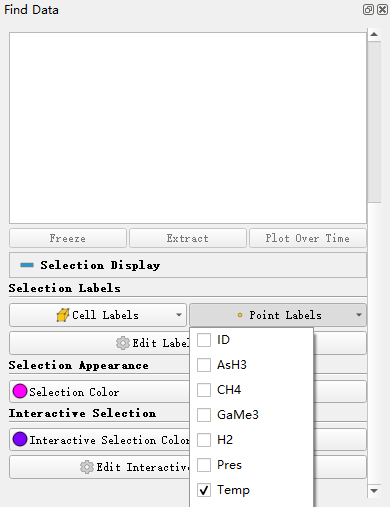
选中管道浏览器节点 Contour1,点击工具栏Find Data按钮,如下图所示
-
在打开的 Find Data面板中,指定Point Labels为变量Temp
-
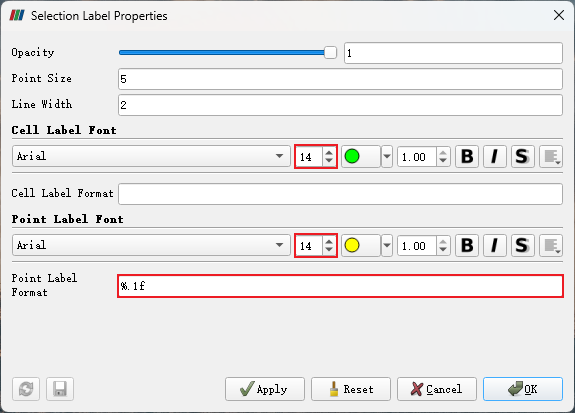
点击按钮 Edit Interactive Label Properties打开属性设置对话框

-
如下图所示指定 Point Label Format为%.1f,表示保留小数点后1位有效数字
-
选中图形窗口的工具栏中按钮 Interactive Select Points On,在等高线上用鼠标点击
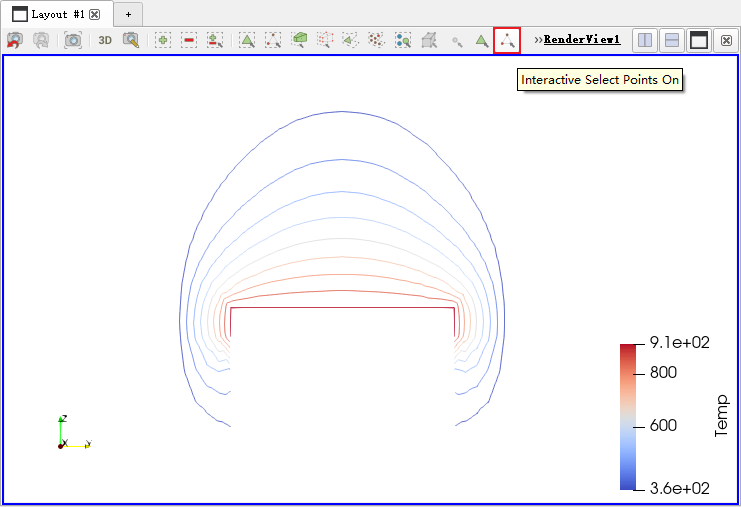
-
可以看到等高线上显示了数据
-
将Slice显示为Temp,最终图形如下图所示。
(完)

本篇文章来源于微信公众号: CFD之道


评论前必须登录!
注册